Tables for Every Use Case
Color tabs, embedded charts, heat maps, and search—core features for serious data tables.
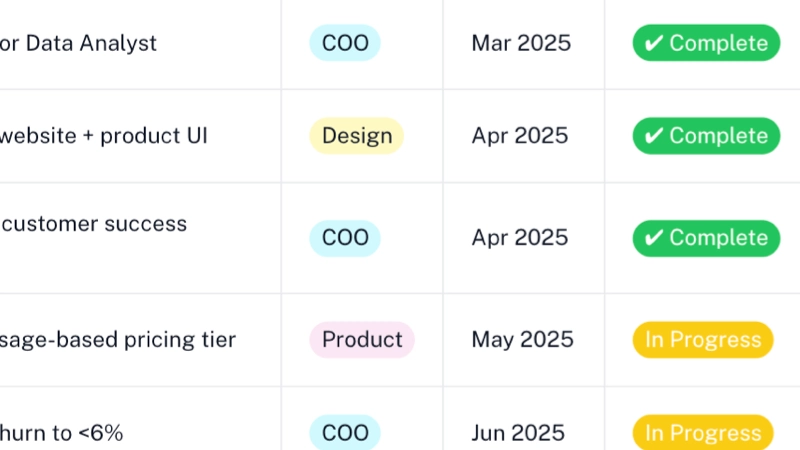
Color-coded tabs
Use pill-style color tabs so categories and values stand out and stay easy to scan.
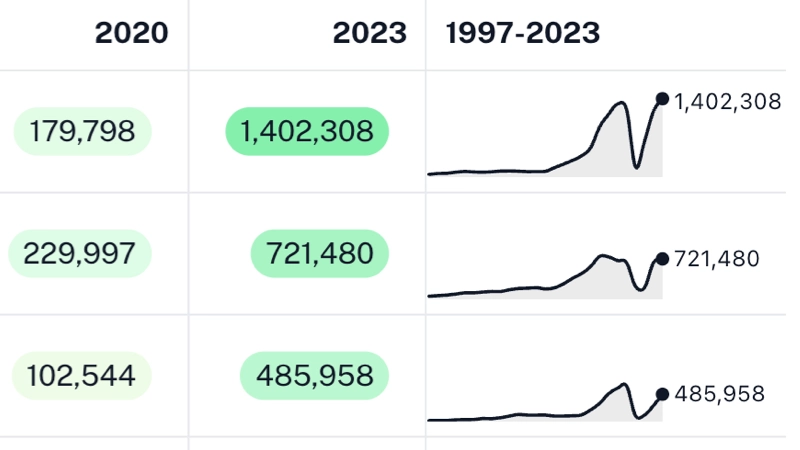
Embedded charts
Add line, bar, or column charts inside table rows so trends sit beside your numbers.
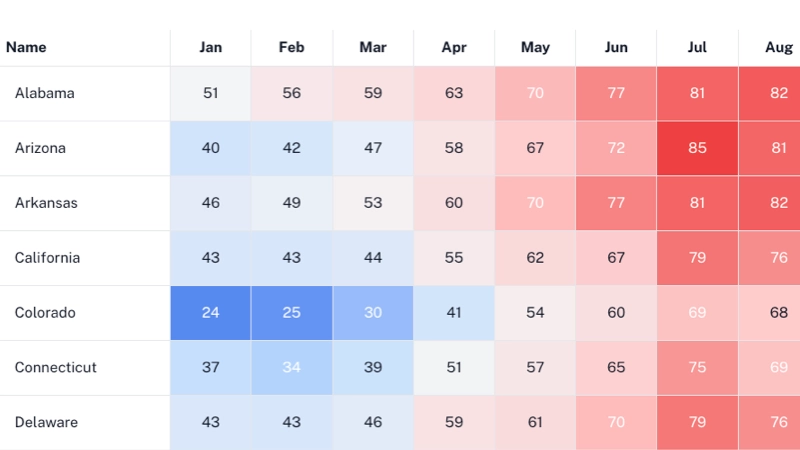
Heat maps
Color cells from numeric values using gradients and scales—heat maps built from your table data.
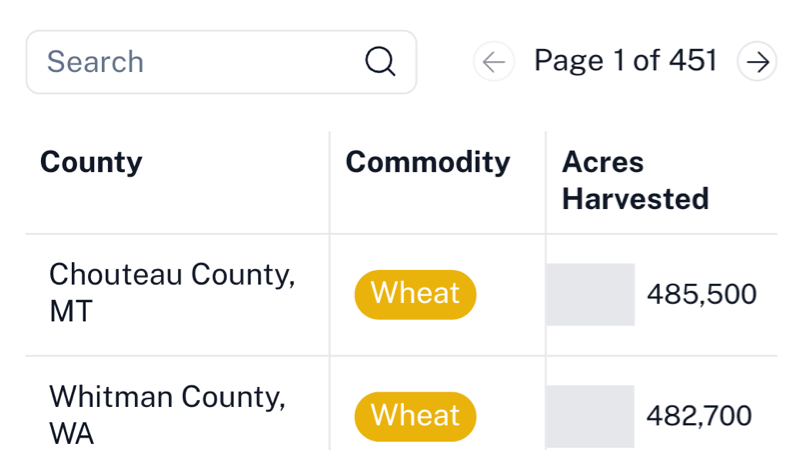
Search & pagination
Turn on search and paging controls so readers can find rows and move through large datasets.
Powerful Table Features
Professional tools that make your tables more engaging and informative
Smart Pagination
Set custom rows per page with intuitive navigation controls that appear automatically when needed.
Global Search
Search across all table data with fuzzy matching and customizable placeholder text for better user experience.
Row Numbering
Add automatic row numbering to help users track and reference specific data rows in your tables.
Flexible Sorting
Enable user sorting by clicking column headers or set default sort order for consistent data presentation.
Embedded Visualizations
Add line, bar, or column charts within table cells to show trends and patterns alongside your data.
Data Aggregation
Automatically group and aggregate data by category fields, showing sums or averages for better analysis.
Column Selectors
Connect tables to selector elements to dynamically show or hide columns based on user preferences.
Responsive Design
Tables automatically adapt to different screen sizes with horizontal scrolling for mobile devices.
Custom Styling
Customize cell padding, row heights, vertical alignment, and colors to match your design requirements.