Display Styles for Every Use Case
From simple category selection to complex multi-dimensional filtering — find the perfect filter type for your data exploration needs
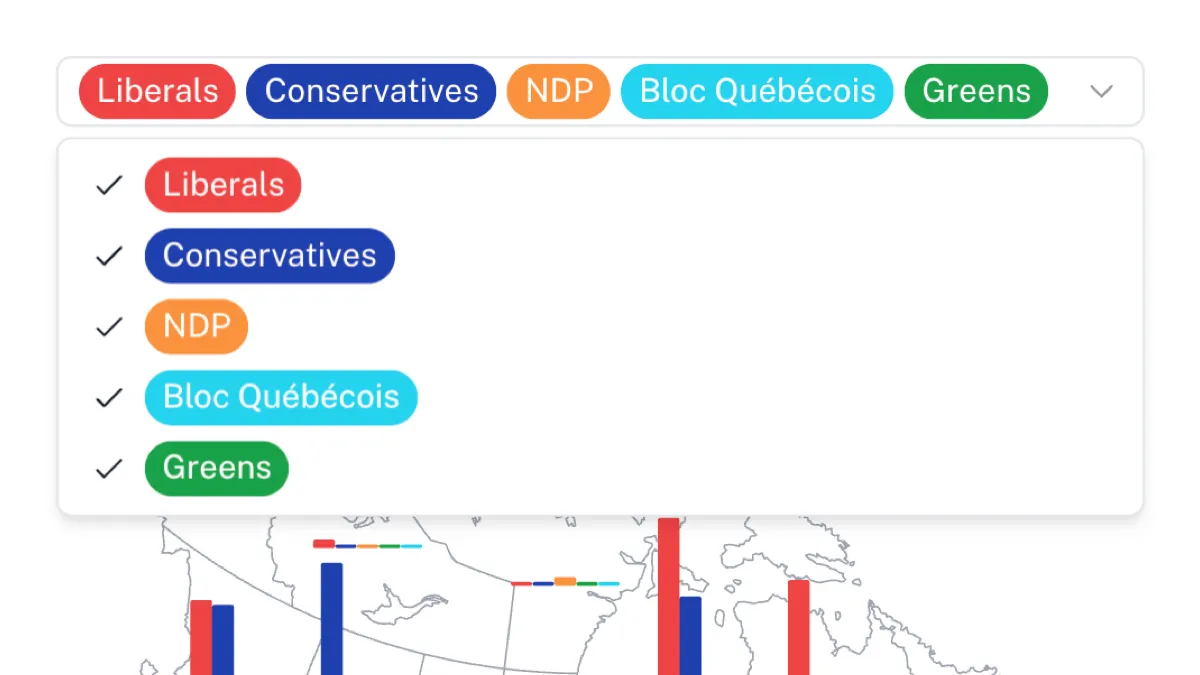
Dropdown Filters
Create clean, searchable dropdown menus that let users select from predefined options with support for single or multiple selections.
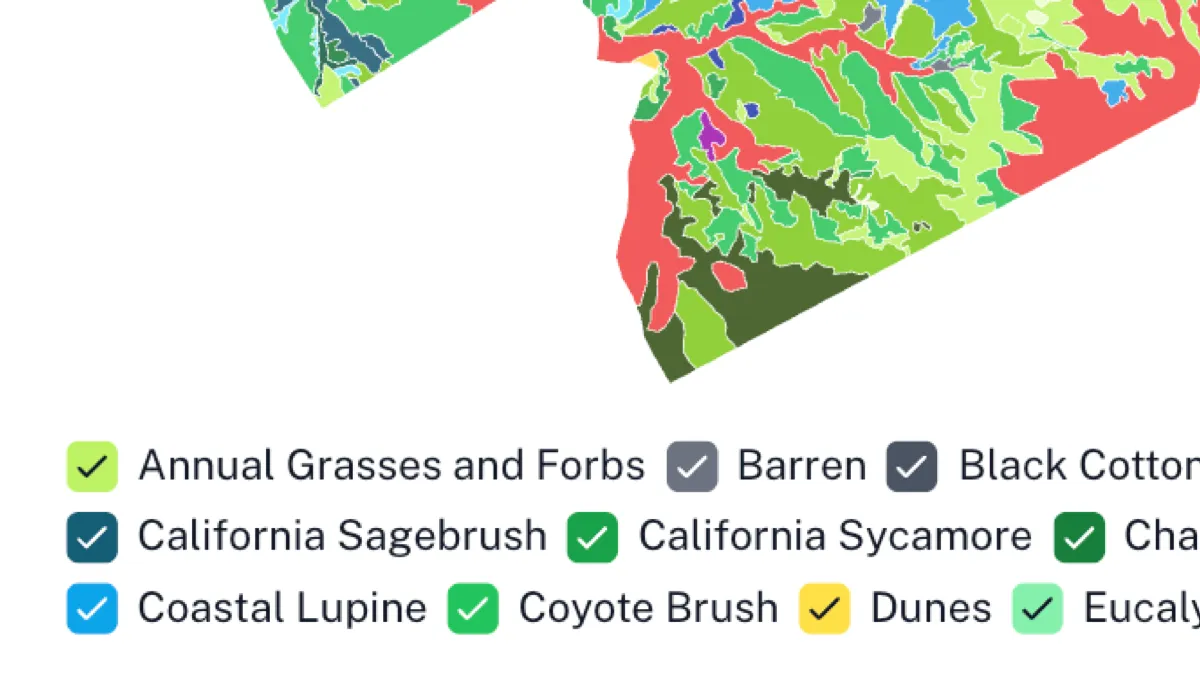
Checkbox Filters
Display multiple options as checkboxes for easy multi-selection, with horizontal or vertical layouts and color inheritance from connected charts.
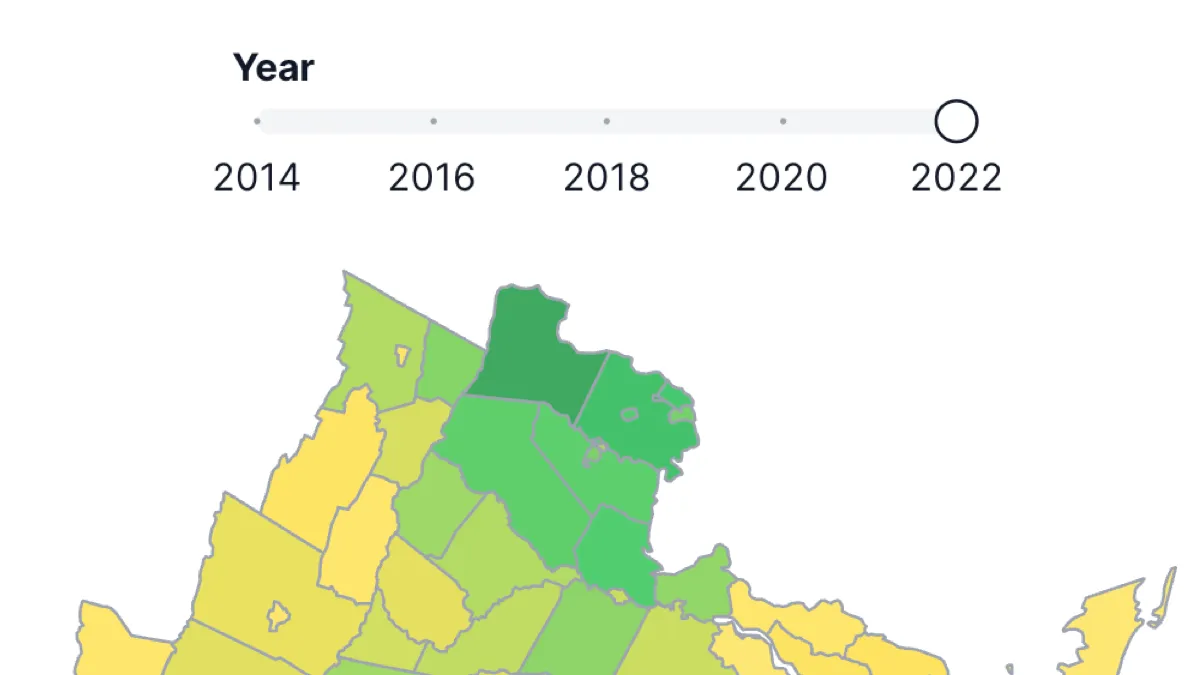
Slider Filters
Interactive range sliders for numeric data with single value or range selection, perfect for filtering by dates, prices, or quantities.
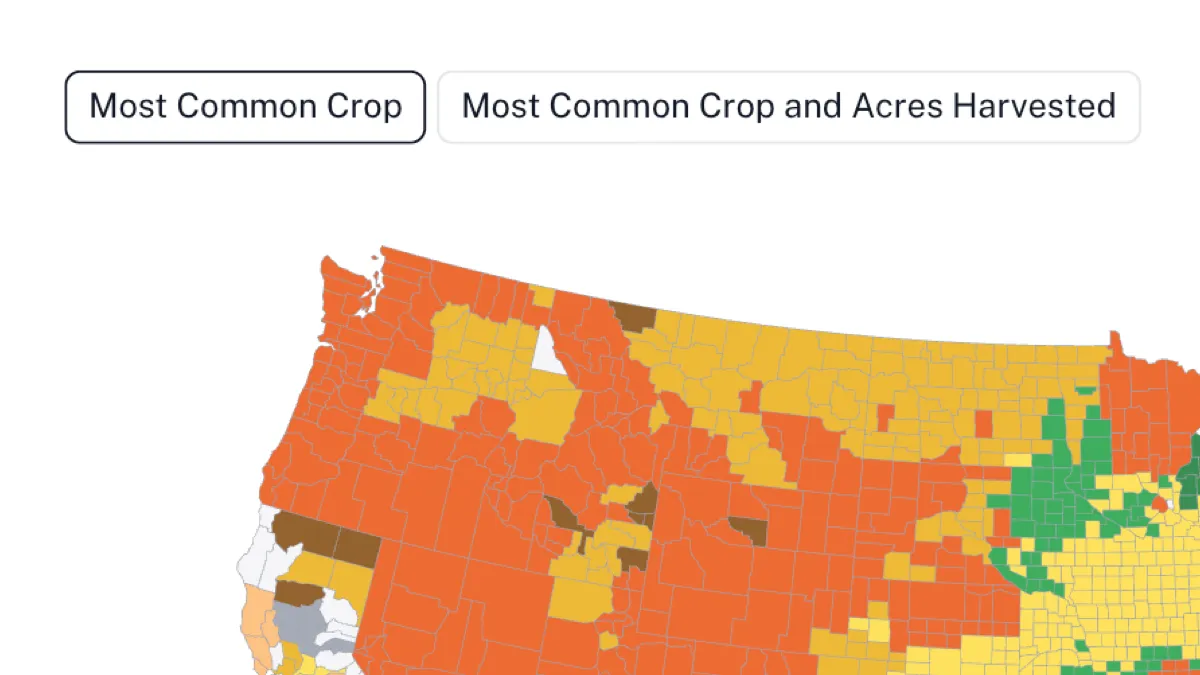
Button Filters
Toggle-style buttons that provide a compact, intuitive interface for filtering data with visual feedback and color coordination.
Need to Control Data Series?
When filtering won't work, selectors will. Use selectors to control which data series (columns) are displayed in wide format data.
Controlling Wide Format Data
Use selector elements to control which columns are displayed as data series in charts, maps, and tables
Control the Display Format
Display selectors in multiple formats: checkboxes, dropdowns, buttons, and legends
Multi-Element Control
Connect one selector to multiple components for coordinated series management
Advanced Filtering Features
Professional tools that make your filters more powerful and user-friendly
Multi-Element Connections
Connect a single filter to multiple charts, maps, and tables simultaneously, creating coordinated data exploration across your entire visualization.
Cross-Dataset Filtering
Filter elements can work across different datasets by matching field names, enabling complex data relationships and unified filtering experiences.
Color Inheritance
Filters automatically inherit colors from connected charts and maps, creating a cohesive visual experience that maintains data consistency.
Advanced Logic
Configure fallback behaviors, null value handling, and annotation filtering to create sophisticated filtering workflows that match your data needs.
Real-time Updates
Filters provide instant feedback as users interact with them, updating connected visualizations immediately for seamless data exploration.
Flexible Layouts
Customize filter positioning, alignment, and spacing to integrate seamlessly with your visualization design and user interface.
Search & Navigation
Built-in search functionality for dropdown filters and intuitive navigation patterns that help users quickly find and select filter options.
Export & Sharing
Filter states are preserved when exporting visualizations, ensuring your audience sees the same filtered view you've configured.
Hierarchical Filtering
Connect filters to other filters to create cascading filter systems that progressively narrow down data based on user selections.